Going into the 2016 IRONMAN 70.3 World Championships, Lionel Sanders knew he would have to put in a big effort to reach the podium and possibly take the title. He pushed the pace on both legs and fought all the way to the line. View his numbers from race day to see just how hard he pushed himself.
The Bike
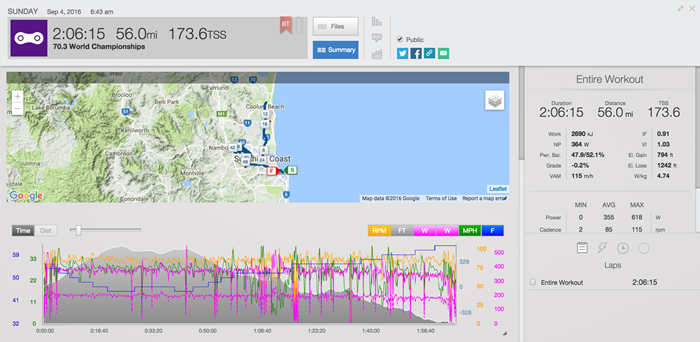
Exiting the water over three minutes back of the lead group, Sanders had to push early to close down the gap. His Peak 20 Minute Power came in the first 20 minutes, where he averaged 380 watts, 5.08W/kg, at 28.6mph. This was a big effort and is reflected in his Intensity Factor® (IF®) of .95 for that time frame. Over the first half of the course, Sanders averaged 369W, or 4.93W/kg at 28.2mph. His Variability Index (VI) was 1.01, showing that while hard, his effort was consistent and smooth. His IF was .93, which is slightly higher than what we saw in his winning effort at 70.3 Mont Tremblant, and a high value, even for an athlete of Sanders caliber.
In the second half of the bike, Sanders did lose some power, but still was able to put out his Peak 5 Minute Power of 408W, or 5.45W/kg on a slight incline around the 32 mile mark. His IF dropped to .89, but his VI increased to 1.04, showing that he was spiking his watts a bit more than earlier. Part of this is likely due to the second half of the course having more rolling terrain. Over the final 28 miles, Sanders averaged 342W, or 4.57W/kg. While a 25 watt differential between the first and second half of the course seems like a lot, it is in line with what we saw at Mont Tremblant and his win at the 70.3 North American Championships in St. George, Utah.
Over the full 56 miles, Sanders averaged 364W, or 4.74W/kg at 85rpm and 26.6 miles. His VI was 1.03 and his IF was .91. The wattage, VI, and IF are identical to his ride in St. George, so it was another good performance.

View Sanders’ full PowerTap file.
The Run
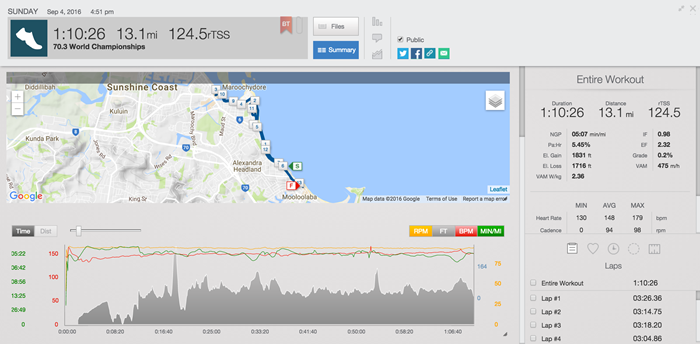
Off the bike with two minutes to make up, Sanders had his work cut out for him on the run. Similar to the bike, Sanders did start out fast, starting out at just under a 5:00 per mile pace. He dialed it back a bit, but his data shows a consistent pace of 5:10 to 5:20 per mile. Throughout the run, his heart rate stayed very low, in the 140’s, and his cadence is consistently at 90 or above. This shows how efficient he is and his amazing aerobic capacity. His run time of 1:10:34 was the fastest run split of the day.

So while the result was not want Sanders was hoping for, it certainly was not for lack of effort. His data clearly shows that he put out his usual strong bike and run combination. Look for Sanders to be highly motivated to show what he can do at the IRONMAN World Championships in October.


