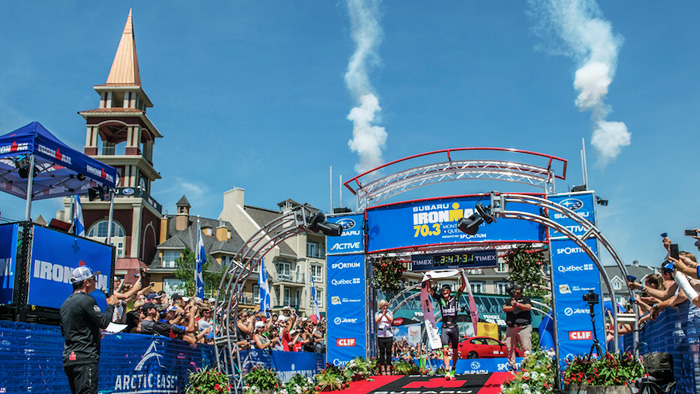
Canadian Lionel Sanders once again stormed the bike and run to take the win at IRONMAN 70.3 Mt. Tremblant. Quickly making up ground after coming out of the water over three minutes back of the leaders, Sanders pulled away on the bike and showed his ability to run hard to the finish. Here, we take a look at his power on the bike to show the effort he puts out on race day.
Sanders’ initial plan was test out his power plan for 70.3 Worlds. “I know at 70.3 Worlds I will need to push the largest amount of power I have ever pushed in my life in order to contend for the win,” he said. “I wanted to test out my power plan for that race in Tremblant.”
Unfortunately, his legs had other ideas. “Right from the get go, I could tell that I did not have the legs to do it,” commented Sanders. His Average Power (AP) was 368W for the first 20 minutes, but he chose to back off a bit. “I decided to hold as close to 350 watts as possible,” he remarked. He executed this well, ending up with an AP of 345, or 4.61w/kg for just over two hours.

See Sander’s full PowerTap file here.
- Sanders held 345W and 27.1mph for the 56 mile ride.
- His Intensity Factor was .88, meaning that he held 88 percent of what he can hold for one hour for the entire ride.
- Sanders was pretty even paced through the ride with his NP dropping only 7 watts between the first and second half of the bike.
- During the second half of the bike, Sanders spiked his watts a bit more on the climb with a VI of 1.03 versus 1.01 for the first half.
- His Peak 20 minute power was 368W, which was set at the start of the bike.
- In just over two hours, Sanders expended 2523 calories.
While 345W for over two hours is a lot to hold, it is very well within Sanders’ capability. His Intensity Factor (IF) for the ride was .88, meaning that he held 88 percent of his Functional Threshold Power (FTP). So while Sanders could certainly go harder on the bike, he holds plenty in reserve for the run.
Another break from his initial plan was Sanders’ decision to spike his watts on the climbs. “I have been doing a lot of climbing in practice, so anytime the speed dropped below 25 km/hr, I got out of the saddle and spiked the power,” he said. “In the last few races, I have held my power very steady throughout much of the race, so this time round it was nice to ride a little less calculated and allow the body to do as it wished.” His biggest spike in power came at the 31 mile mark, where he held a Normalized Power® (NP®) of 402 watts for over five minutes on a 4.7 percent grade climb.
Interestingly, though Sanders rode more by feel and felt that he spiked his watts more than in previous races, when compared to his file from his victory at IRONMAN 70.3 St. George, his power output was actually slightly smoother. His Variability Index (VI) at St. George was 1.03, while at Mt. Tremblant it was 1.02. This is likely due to two factors- the differences in course terrain and how his legs felt.
 While both courses have plenty of climbing, 4262 ft. for Mt. Tremblant compared to 3374 ft. for St. George, Mt. Tremblant features short, punchy climbs versus the longer, sustained climbs of St. George. The short climbs of Mt. Tremblant allowed Sanders to push his watts, but were not sustained long enough to impact his VI more.
The other factor that likely had an effect is the simple fact that Sanders was having what, for him, was a slightly off day. His Average, Normalized, and all Peak Power values were higher in St. George with the exception of his one and two minute power.
Even though it was not the day he hoped for, Sanders still set the fastest bike by almost five minutes and went on to have the fastest run of the day as well. This amazing effort allowed him to break the tape almost five minutes up on second place.


